DB Impact (Resource→DB)
This screen allows you to check the relationships between resources belonging to each application and the tables in the database (hereafter DB, Database). It is based on DBIO among the resources, and you can check the input/output type, table/column names, and written SQL.
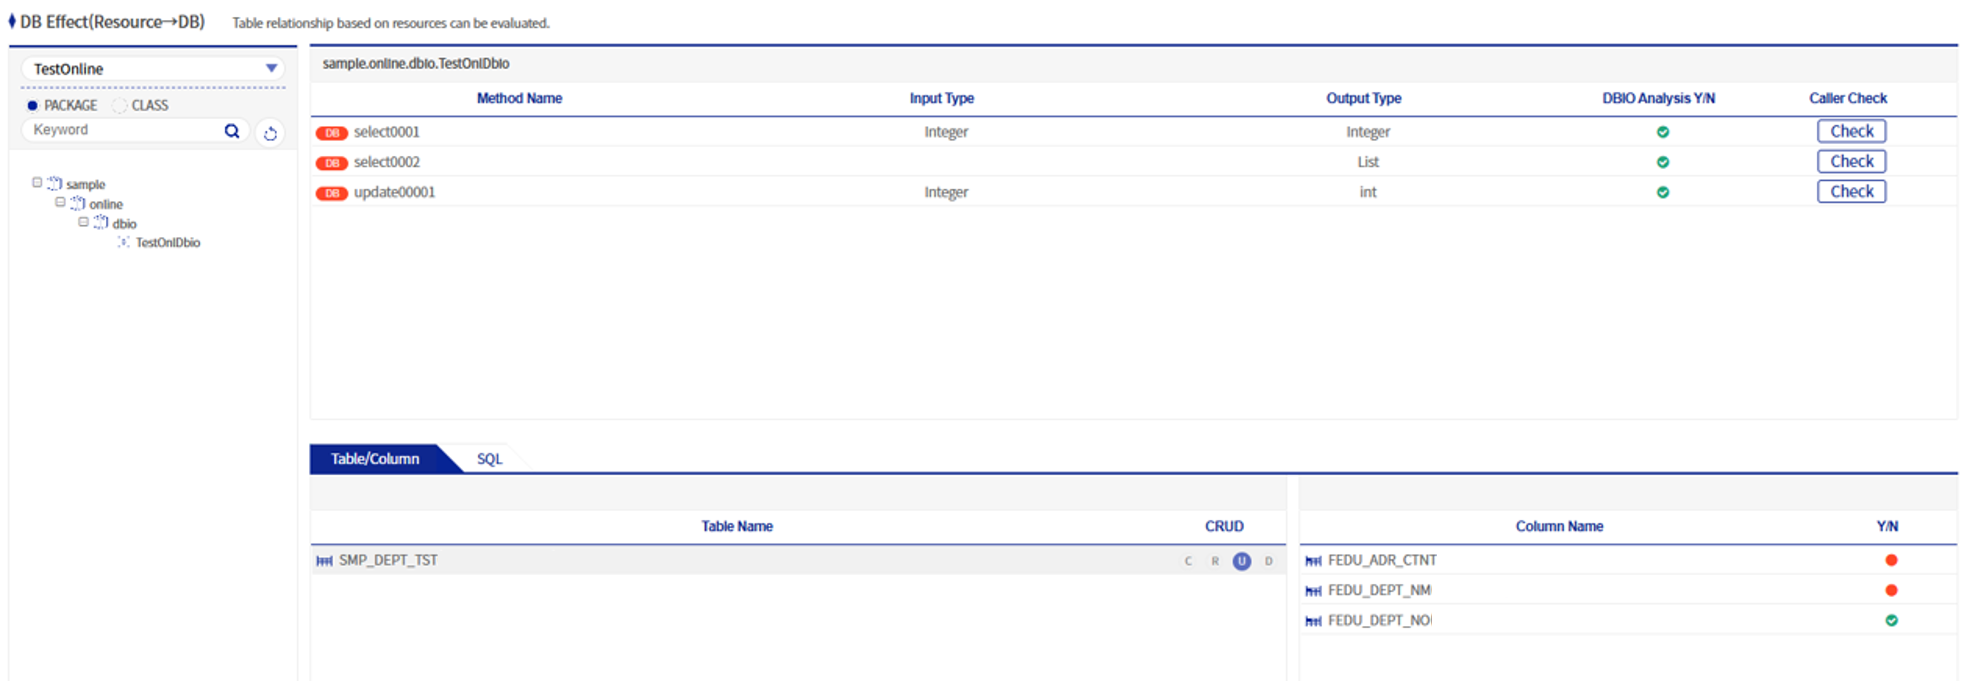
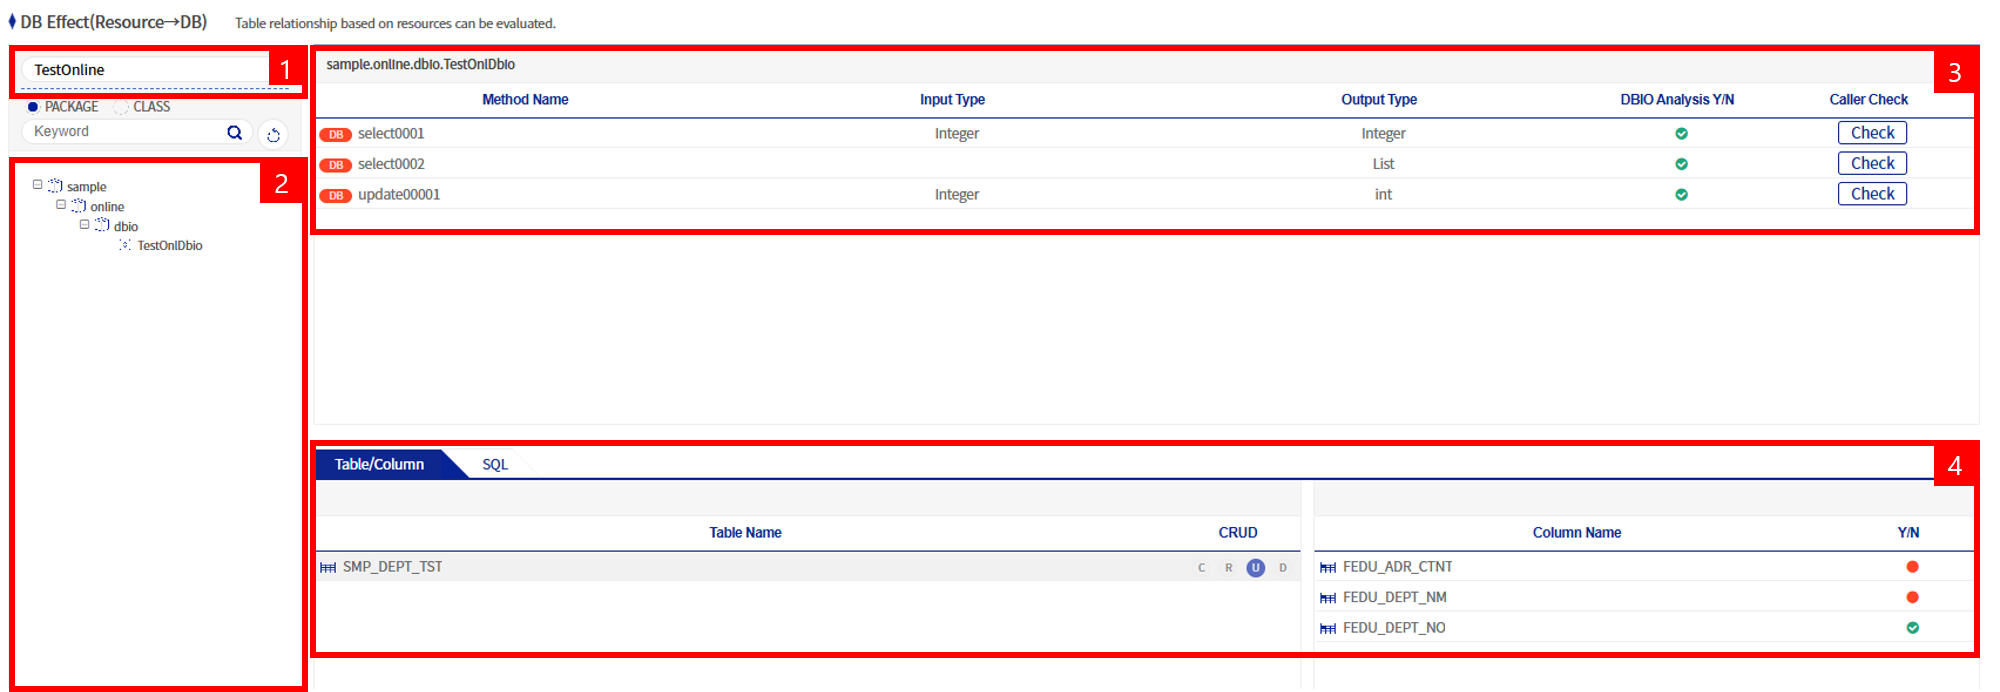
The DB Impact (Resource→DB) screen can be largely divided into four areas.
-
Application selection area
-
Resource directory area of the corresponding application
-
Method information area belonging to the corresponding resource
-
Tables and columns used by the corresponding method, and written SQL
1. Application selection area
It displays the list of applications under APP_HOME configured in the impact analysis script dniAnalyzer.sh.
2. Resource directory area of the corresponding application
This area displays, in directory form, the resources under the selected application. Typically, the full package and class names are displayed. When you click a class name in this area, the method names belonging to the class and the list of input/output types appear at the top right.
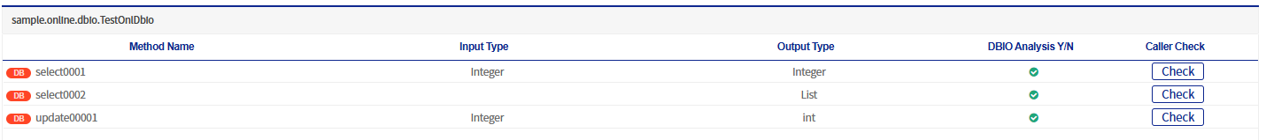
3. Method information area belonging to the corresponding resource
When you click a class name on the left, this area displays the method information belonging to the corresponding class, input/output types, whether DBIO is analyzed, and the Caller verification list.
| Column name | Description |
|---|---|
Method name |
The method names belonging to the class in the grid header section. |
Input type |
The input type of the corresponding method. In the OnlineLogBean class, the method getServiceLog has an input type called ServiceLogOMM. |
Output type |
The output type of the corresponding method. In the OnlineLogBean class, the method getServiceLog has an output type called ServiceLogSingleOMM. |
DBIO analysis status |
A column indicating whether DBIO has been analyzed. If the analysis status is green, it is analyzed data, so when clicked, table/column and written SQL information is displayed. If the analysis status is red, it is unanalyzed data, so table/column and written SQL information are not displayed. |
Caller check |
When you click the Caller check button, the resource analysis screen is rendered using the corresponding DBIO class and method name. |
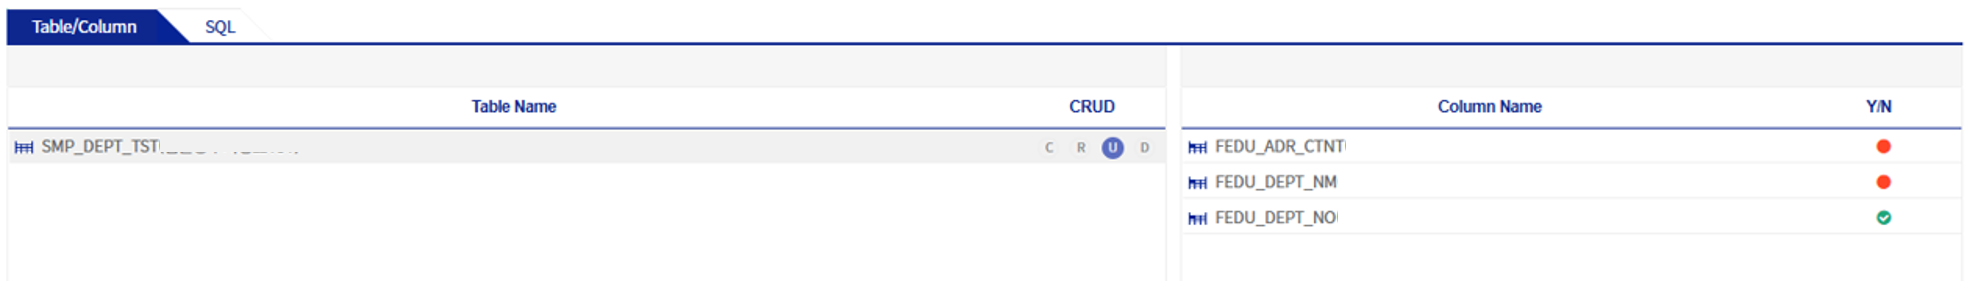
4. Tables and columns used by the corresponding method, written SQL
When you select a method whose DBIO analysis status is Y (green) from the method list in the upper right, the table/column name information and written SQL are displayed.
| Column name | Description |
|---|---|
Table name |
The table name used in the selected DBIO. |
CRUD |
CRUD is an abbreviation for Create, Read, Update, and Delete, and refers to basic data processing functions. If there is a colored icon in the CRUD of each table, it means that the corresponding SQL is used. For example, if the light is on for R, it means that the table is used in a select statement, which is a Read. |
Column name |
When you click the table name on the left, all column names belonging to that table. |
Usage status |
Usage status indicates whether it is used; if the column is used in the SQL statement of the corresponding DBIO, a green light is displayed, and if it is not used, a red light is displayed. |
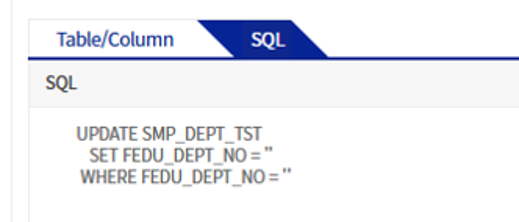
A single method existing in the corresponding DBIO has one SQL statement, and this area displays it.