Error Monitoring
This is a statistics screen that provides error monitoring by date, by period, and by condition-based event. It consists of three tabs: Error monitoring by date, Error monitoring by time period, Event monitoring by condition.
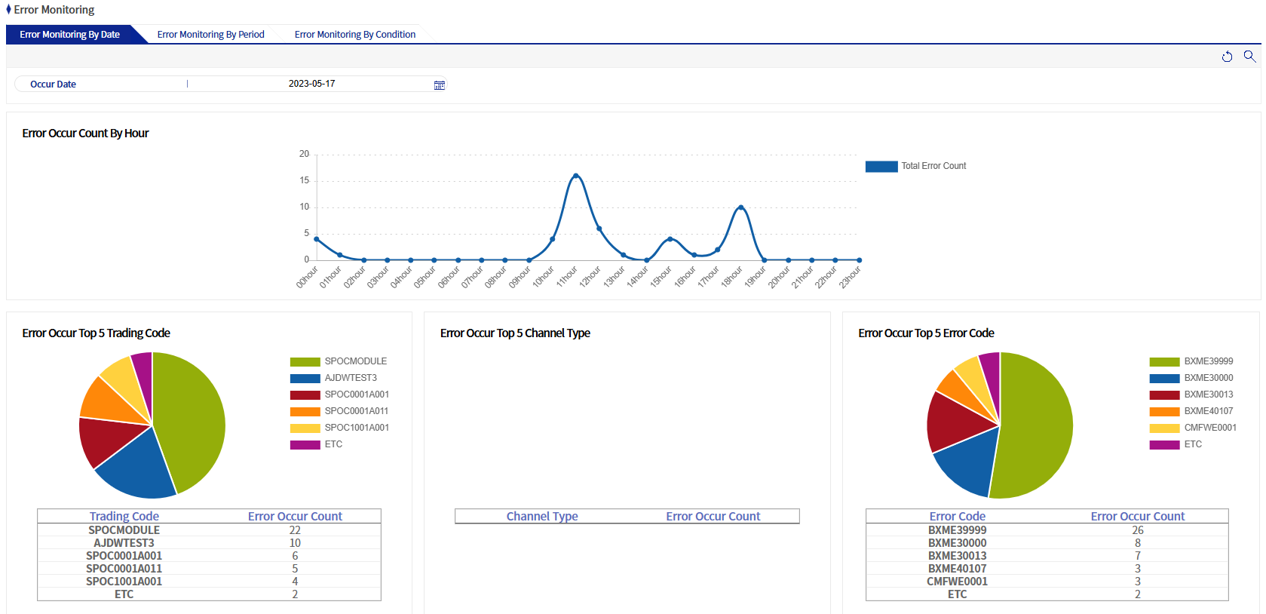
1. Error Monitoring by Date
This screen provides error statistics for 24 hours on a specific date. After setting the date of occurrence and the operating date (when using the operating date) and running a query, the number of error occurrences from 00:00 to 24:00 is output as a graph. In addition, the top 5 transaction codes, top 5 channel type codes, and top 5 error codes with the highest number of errors that occurred during the day are output as pie charts.
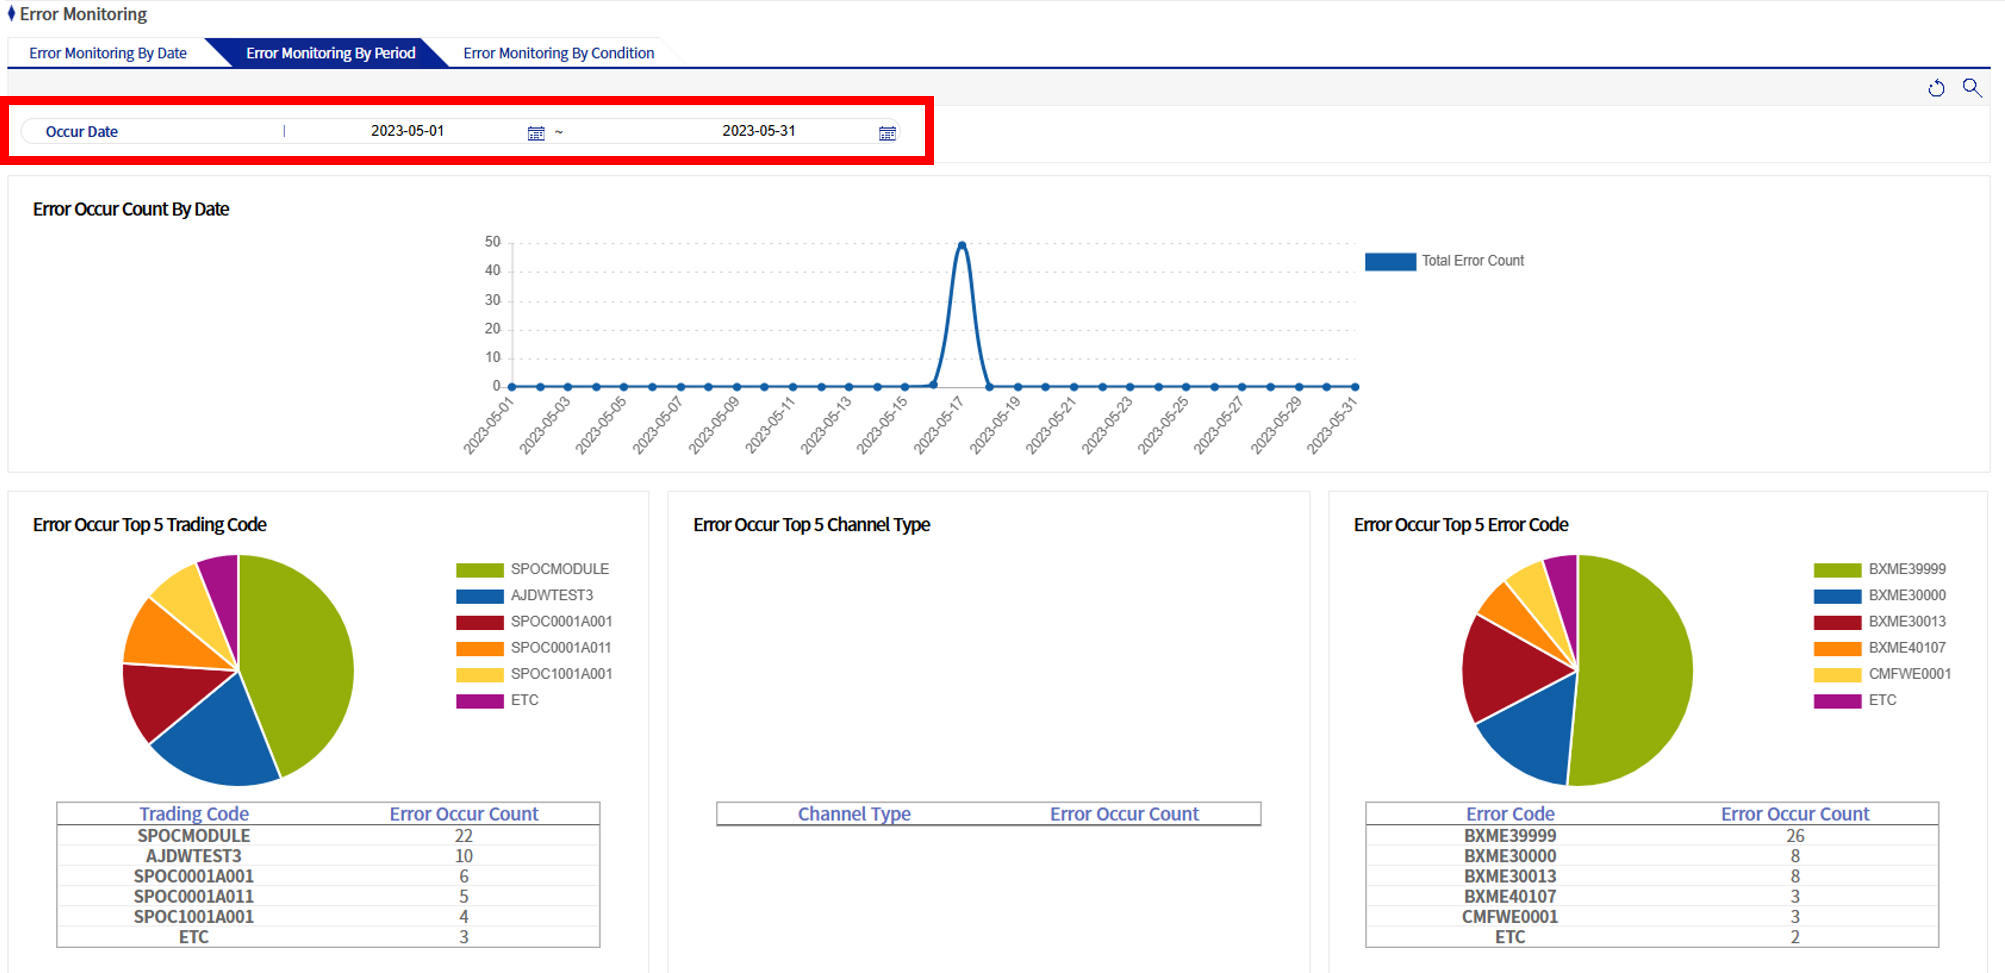
2. Error Monitoring by Time Period
This screen provides error statistics for a specific period. Its screen composition is the same as Error monitoring by date, and the difference is that you can specify a range for the date of occurrence and the operating date.
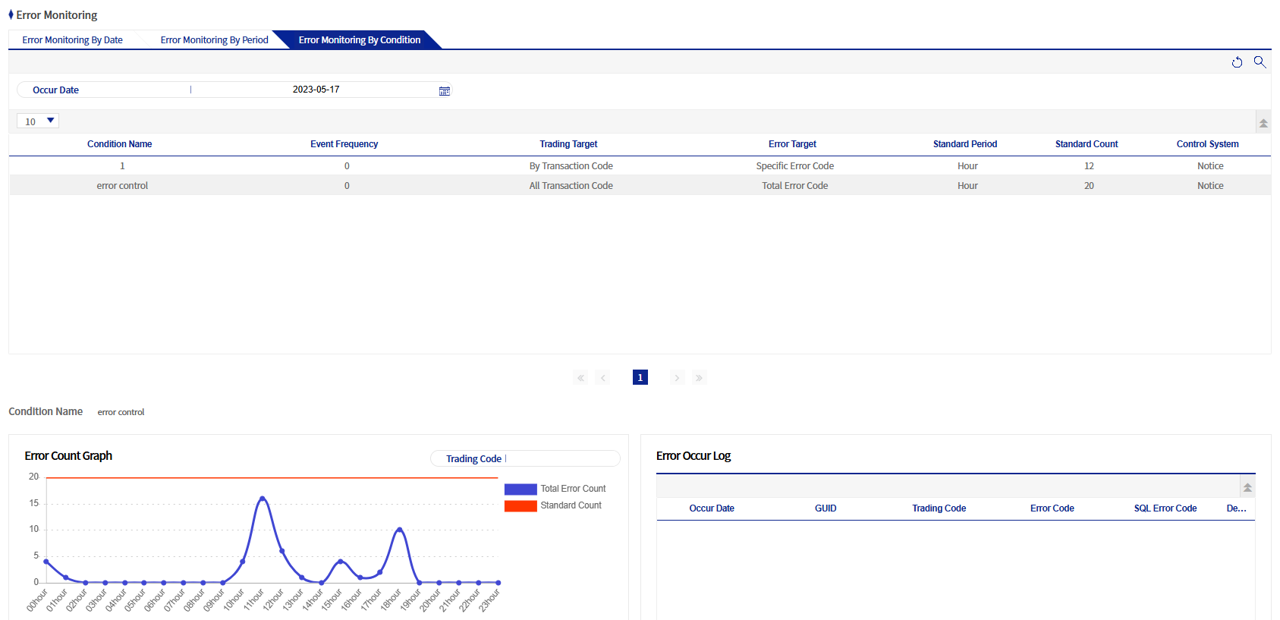
3. Event Monitoring by Condition
This is a screen where you can query error statistics by date of occurrence and operating date for the conditions registered in Error event condition management. When you click a condition in the list, detailed statistics are displayed at the bottom. When you click the error count by time in the error count graph, you can view the details of error occurrences, and when you click the button in the detail column, it is rendered to the Online Log Inquiry - Error Log screen.