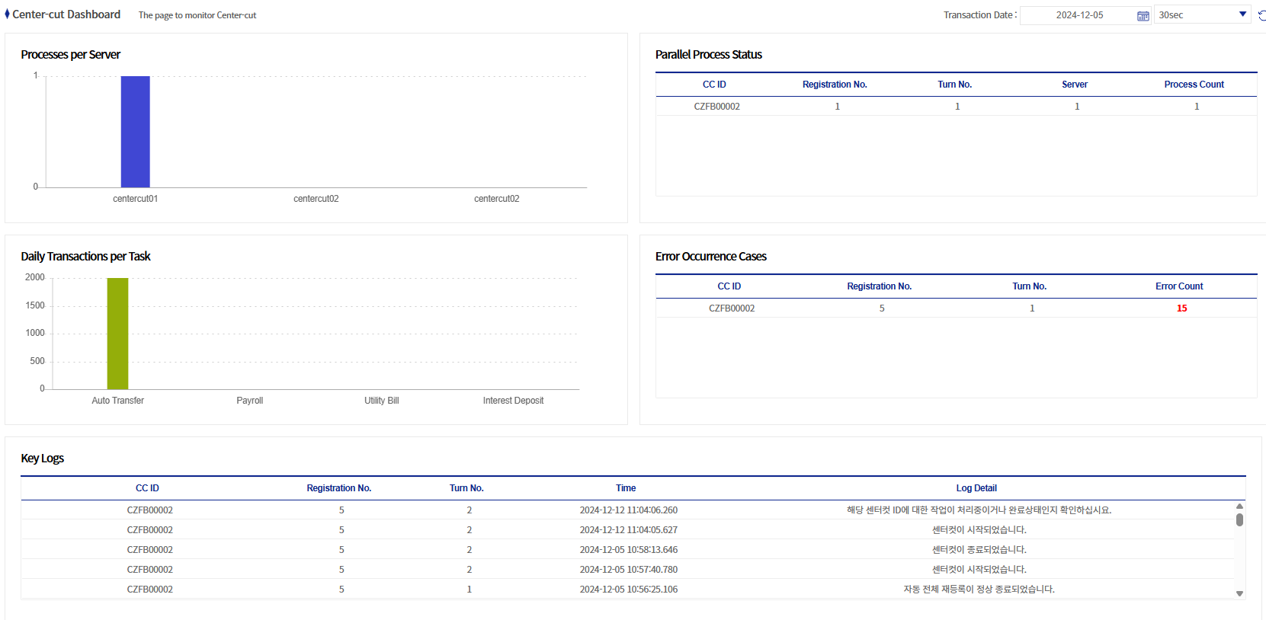
Dashboard
This screen monitors the center-cut.
-
The following is a detailed description of the center-cut dashboard.
1. Detailed Conditions of the Dashboard
You can set the center-cut processing date and the refresh interval.
-
Center-cut processing date: Can be selected in a calendar format. The center-cut execution data of the selected date is displayed.
-
Refresh interval: You can select from No auto refresh / 10 seconds / 30 seconds / 60 seconds.

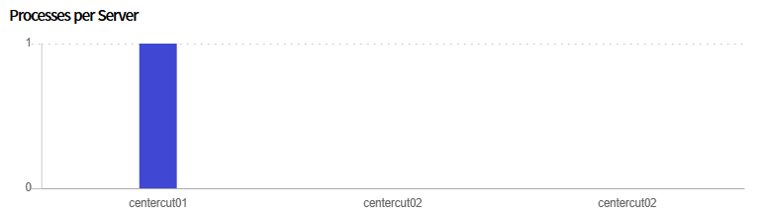
2. Number of Processes per Server
This is a graph that shows the number of processes per server. Among the servers registered in Center-Cut Server Management, processing servers are the subjects of the statistics.
In the example below, there are processing servers Emerald_ccProc01 and Emerald_ccProc02, and you can see that one Emerald_ccProc01 process is running.
3. Parallel Process Status
This area shows the real-time status of center-cut processes being executed.
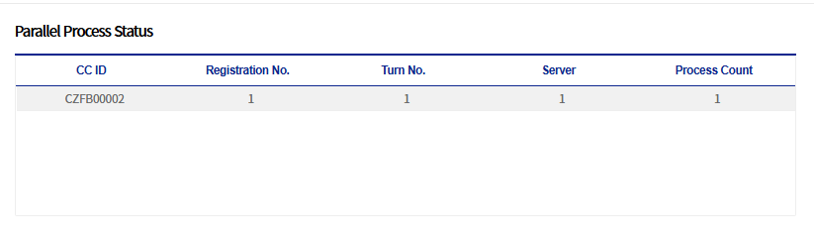
| Column name | Description |
|---|---|
CC ID |
This is the center-cut ID (Center-Cut ID). It can be checked in Center-Cut Job Status. |
Acceptance Number |
A single unit in which the center-cut is executed. It can be checked in Center-Cut Job Status. |
Round Number |
When a center-cut processing error occurs and error reprocessing is performed, the round number is incremented for the same Acceptance Number. It can be checked in Center-Cut Job Status. |
Server |
Represents the node number. |
Number of processes |
Represents the number of processes in which the center-cut is being executed. |
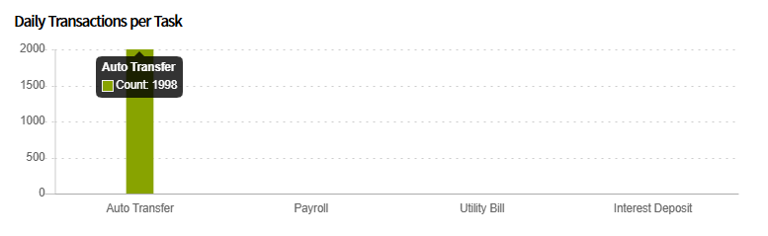
4. Number of Transactions Processed Today by Job
This is a graph of the number of transactions processed today by job.
|
Job types can be added/modified in the common code. By default, they can be added/modified in [BXMCC0013] Center-Cut L2 application code, and if the common code ID is changed, BXM Web Admin Customization is required. |
In the example below, you can see that 4,000 transactions of the interest deposit job have been processed.
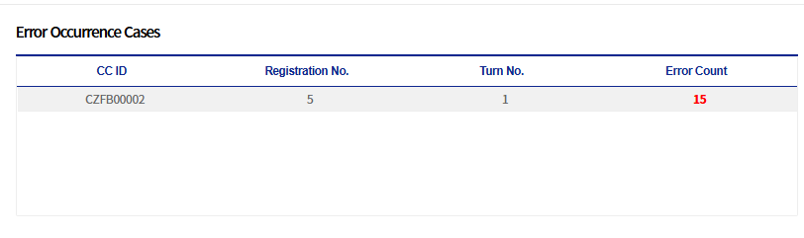
5. Error Occurrence Status
This grid shows the error occurrence status. The columns have the same meaning as those of Parallel Process Status, and the number of errors represents the number of errors that occurred during the corresponding center-cut execution.